

Calculating the K-Factor from App Invites
tl;dr The k-factor is an important metric for measuring viral growth. I'll show you how to calculate it when users invite other users to an app.
Word-of-mouth marketing is crucial. Actually, it’s not just that. In a sense it is the only sustainable form of marketing. When you build a product, it should eventually become so good that your users recommend it to others. They will do this for free and of their own accord, simply because they love your product. Your user base will grow organically and - assuming your product also has decent retention (i.e. existing users will continue to use your product) - your active user base will grow.
 Viral growth. Bad with diseases. Good for your product.
If your product is a mobile app or a web application with a simple signup process, it makes a lot of sense to facilitate word-of-mouth marketing by enabling existing users to invite new users and (possibly) reward them for successful invites. The reward could be anything from a monetary referral bonus in an online shop, replenished lives in a game, to the simple benefit of a better experience when friends join an ecosystem the inviter is already a part of. Once you have built this feature and can track when users send invites as well as when new users sign up via an invite, you might be wondering how to measure the speed and effectiveness of the organic growth driven by invites. I’ll show you how to do exactly that.
If you want to skip the details, you can cut to the chase here.
Viral Growth and the K-Factor
When users invite new users, all that matters are two parameters:
- The K-Factor tells you how many new users each of your existing users acquires on average.
- The viral cycle time tells you how quickly that happens.
As the term viral growth suggests, the terminology is borrowed from epidemiology. You can think of the K-Factor as the contagiousness of the virus (how many people are infected by a person carrying the virus) and the cycle time as the infection interval (how long does it take for a newly infected person to infect others). While both of these certainly sound unpleasant in the context of epidemic diseases, obviously “infections” are good when they mean people are spreading the word about your app. Specifically:
- A high K-Factor is good. This means any infected person (an active user of your app) infects many other people (tells them about your app, they like it and start using it).
- A low cycle time is good. This means infections (active users successfully inviting new users) happen quickly.
A K-Factor > 1 and a small cycle time can lead to explosive exponential growth. The general principle behind this is easily understandable (“If, on average, every user acquires a little more than one new user within a few days and each of those users again acquires more than one new user …”). However, if you do the actual math and model the growth in a spreadsheet, the sensitivity of the exponential growth function with respect to both the K-Factor and the cycle time can blow your mind. I won’t dig any deeper here, but I strongly suggest you do the modelling exercise for yourself, because it really helps you understand what difference minute optimizations in your app could make if they positively affect K-Factor or cycle time.
The K-Factor in Theory
If you go by the textbook (Wikipedia) definition of the K-Factor, it is to be calculated as
where is the number of invites sent by a user (e.g. 5 invites sent), and is the average conversion rate of those invites (e.g. 1 in 5 invites = 20% accepted). So in order to calculate the K-Factor of each user, we would need to know how many people the user sent invites to and how many of those invites were accepted. Once we have calculated the individual K-Factor for each user, we can average them up and - boom! - there is the K-Factor for our app.

The Thing with Invites
While the idea of tracking each and every invite may sound appealing, it’s actually not that straightforward in practice. No matter how you design your invite system - at a certain point your users will have to share some sort of information externally (an invite link, a referral code). This is where you end up in a dilemma:
-
Sharing should be as easy and convenient as possible in order to maximize dissemination. However, if you just let the user copy the invite info or share it via another app, you lose track of who and how many people the invite is actually sent to.
-
If, on the other hand, you want to have total control of the sharing/sending process you have to ask for a bunch of permissions (address book, sending text messages etc.) that will make your app look like a creepy control freak.
The following is a real-life screenshot of the Android permission page of a popular location-sharing app that handles all sharing activity from within the app:
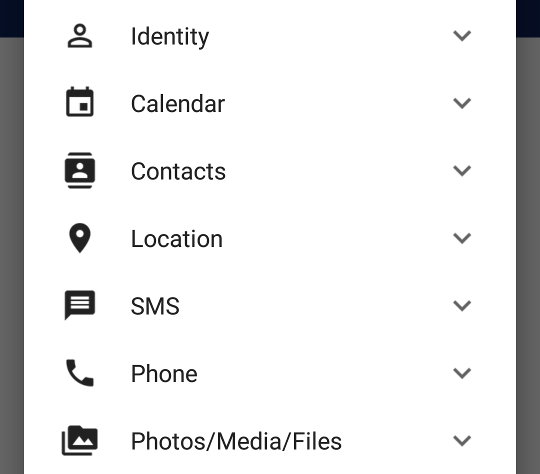
My advice to you: If you don’t need these permissions for other, well-justified use cases - don’t do this. Ever. The top priority is that your users share invites. This process should be as comfortable as possible and should thus make use of the built-in sharing dialogs or the “copy to clipboard” functionality of the host OS. These require no extra permissions and the user can freely decide how, when and with whom they want to share the invite. Also, you won’t have to implement and maintain a slew of additional sharing functionality that has nothing to do with the core of your app.
Before we proceed, let me remark that - even though you don’t have detailed stats on sent invites with the external sharing approach - you can still know which users try to share an invite. To obtain this info, log an analytics event right before users leave your app to share, e.g. when they have requested a referral code and click on “Share” or “Copy”. This way you will have a pretty good estimate of which users share invites and how quickly/often they do so.
The K-Factor in Practice
So if we don’t track how many invites are sent to whom, how can we calculate the K-Factor at all? Well, it turns out it is still feasible. In fact it’s rather easy. Let’s take another look at the formula of the K-Factor: . Seeing how the conversion rate is simply the ratio of invites accepted and invites sent () per user, we can just cancel invites sent () from the equation and end up with:
The formula is basically just a fancy way of saying that invites do play a role in acquiring new users (if you don’t send any invites, you can’t acquire new users, duh). But for calculating the K-Factor the only thing that’s relevant is how many invites were accepted and not how many invites were actually sent. In other words, a user that sends 20 invites and acquires 2 new users has the same K-Factor as a user who sends 2 invites and acquires 2 new users (namely ).
So to calculate the K-Factor we simply need to track how many invites from a given user were accepted. This should be fairly easy, because new users will join via the invite link or the referral code that was sent to them, which let’s us identify who invited them. Then we average up the individual K-Factors and - bazinga! - there is the K-Factor for our app.
 What window are we looking at?
Time Window and Relevant Users
Now that we’re clear on how to handle invites, calculation should be straightforward. There is just one issue: Like most other performance metrics, we would like a rolling analysis of the K-Factor based on a fixed time window, e.g. the past day, the past week, the past month etc. We do the same with metrics like retention (“Of all users that installed my app two days ago, how many came back yesterday?”), so surely this should be possible for the K-Factor?
It is possible, but we need to realize several things about how growth by invites works.
- A bunch of users might be actively using your product, but not all of them are relevant for calculating the K-Factor.
- Unless your product is invite-only (e.g. in early beta) you will have both invited signups and normal signups.
- Chains of invites can occur within a single day or span multiple days.
- Invites could be sent by both existing users and by newly invited users.
- Unless your invites expire, it’s impossible to specify an upper limit on the acceptance time.
With these aspects in mind here’s an exercise for you: If today is Day 0 and you have analytics data (normal signups, invited signups) for the past 3 days, try to calculate the K-Factor for Day -3 (three days ago).
If your thought process throughout this exercise was similar to mine, you may have come to the following conclusions:
-
To be able to calculate a (lower bound approximation of) the K-Factor we need to specify a time window that corresponds to the expected cycle time. Given the specifics of our app (when and how often do we ask users to invite others, how easy is that process, how easy is it to accept, how long does it typically take to accept), the time window is a best guess for the period in which invited users are “hot” and could “infect” other users. It also reflects the maximum time span in which a sent invite must be accepted to be counted.
-
For the chosen time window we should consider two groups of users: a) “Old” users that send an invite during the time window and b) all new users who signed up during the time window. The rest of our user base should be ignored, even if they are active.
The reasoning behind the first conclusion should be obvious. If there is an expiry time for invites, we can simply use that as our time window. If there isn’t, we have a problem: An invite could be accepted after one day or after ten years. In order to come up with any number for the K-Factor we must specify a reasonable threshold for the time window. For the referral program of a real estate company this could be months or even years, for inviting someone to use an app it should probably be no more than a few days. Here’s the good news: You can learn the time window from the behavior of your users. For example, if 80% of your inviters send an invite within the first 2 days, you could use that as your threshold. Also, no matter what time window you choose, you will never overestimate the K-Factor, since invites could be accepted after the time window and the actual K-Factor will be better than your estimate. The challenge is to find a time window that is sufficiently short so that you get timely estimates, but long enough that the majority of relevant invite activity is considered.
The second conclusion may not be as obvious, so join me in this thought experiment: If you have 5.000 daily active users when you start your invite program how many of them should contribute to the K-Factor? All of them? Certainly not, because then your K-Factor would be unrealistically bad (lots of users who didn’t acquire new users). None of them? Probably also not a good idea, because what if 500 of them actually started to send out invites? You’d leave out all those invites. So for your existing active user base the most reasonable thing seems to be to consider those users who send out invites during your analysis time window.
Great, so what about new users that sign up once your invite program is in place? Should we only consider users that joined through an invite? Or just those that send an invite? I personally think neither is a good idea. By the time your invite program is integrated into your product, new users should be incentivized to invite others as part of the onboarding process, at a point where they are sufficiently engaged with your product and can be considered “fully infected”. This should be regardless of whether those users signed up via an invite or not. By the same logic, all fully onboarded or “infected” users should be regarded as potential disseminators, not just the ones that actually send out invites. Suppose that the invites sent from your app would be super effective (e.g. have a conversion rate of ) but, for some strange reason, you could only get very few new users to actually send out invites. If you considered only users that send out invites, your K-Factor would seem to be phenomenal, while in reality it would be rather low. To avoid this bias, you must consider all newly signed up users in your analysis window.
A Toy Example
Now that we have all the ingredients lined up, let’s go through a toy example.
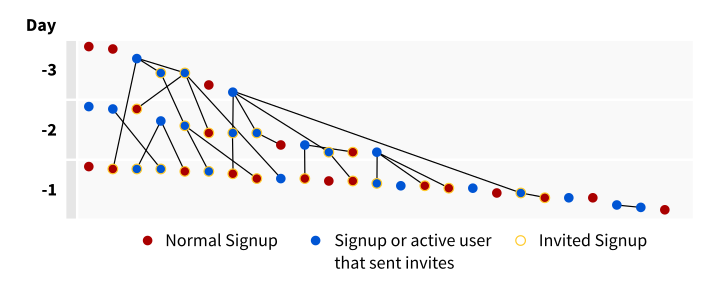 A fictitious chain of signups and invites over three days.
Today is Day 0 and the figure shows analytics data for the past three days. Each row represents an entire day and the dots within the rows represent signup and/or invite events, ordered chronologically from top left to bottom right within each day. Obviously more users are active on any given day, but as explained above, we only consider users that either signed up on that day or had signed up before and sent invites on that day.
The figure reads as follows:
- Red dots represent users that signed up normally (not via an invite) and did not send any invites.
- Blue dots represent (new or existing) users who sent at least one invite.
- Yellow circles mark users who signed up via an invite. The black lines connect them to their respective inviter.
Let’s assume that the time window / expected cycle time for the app is 2 days. This means we have the full data to calculate the K-Factor for Day -3. The histogram of individual user K-Factors on that day is:
| # Successful Invites | # Users |
|---|---|
| 0 | 3 |
| 1 | 1 |
| 2 | 0 |
| 3 | 2 |
| 4 | 1 |
which gives us an average K-Factor of
In a Nutshell
To summarize, here are the key takeaways:
- If your app, website or product has a simple signup process, it is a good idea to implement an invite system to accelerate growth.
- Inviting new users can be incentivized but doesn’t have to. Invites can be really effective when they are actually a feature of your product (“challenge your friends”, “recruit three backers” etc.).
- Make your invite functionality as easy and convenient as possible. For apps, use the inbuilt sharing mechanisms that require no extra permissions.
- Track when invites are shared and when new users sign up via an invite. You might not be able to track to which and how many users an invite is sent. That’s ok.
- Define a time window that represents a reasonable estimate of how long it takes a new user to engage with your product, send out invites and cause others to join via an invite.
- For your app to go viral via invites, the time window should be on the order of days, not weeks or months. Let’s call the number of days .
- To calculate the K-Factor days ago, count the number of users that signed up or sent an invite on that day. Let’s call that number the active users .
- For each active user, count the number of invited signups that the user caused (= successful invites) within the last days (i.e. until today). Record this number per user and let’s call it the individual K-Factor .
- The K-Factor is then calculated simply as the average of the individual K-Factors:
Simple enough, really. However, figuring out which users to consider in which time frame took me some time, so I’m hoping this article may spare you one or several mental detours.